docker容器监控-prometheus
一、docker容器查看资源
docker stats #可以查看容器使用了多少资源、实时刷新的
docker stats --no-stream #打印到屏幕上
然后可以使用awk过滤,然后使用zabbix监控
二、普罗米修斯-prometheus
https://prometheus.io/download/
prometheus官网里面有下载地址和采集器等等等
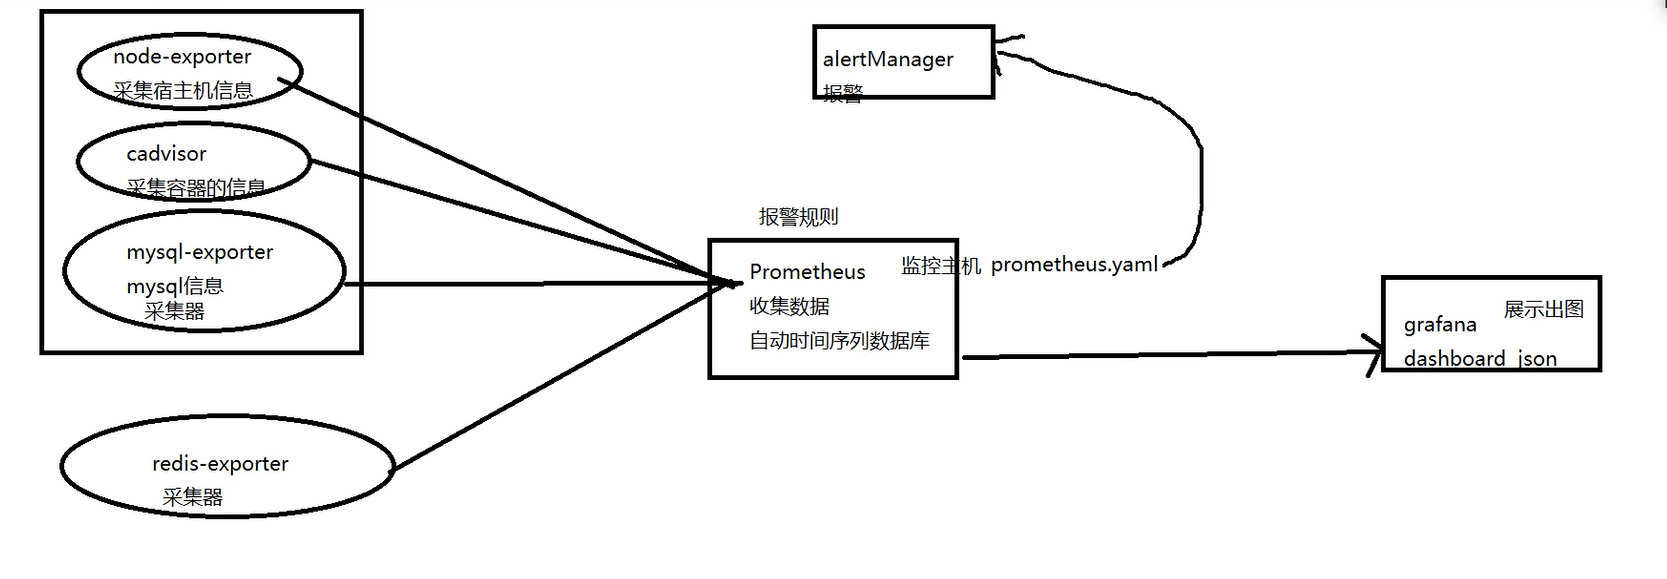
1、客户端节点安装node-exporter
[root@1 ~]# docker run -d -p 9100:9100 -v "/:/host:ro,rslave" --name=node_exporter quay.io/prometheus/node-exporter --path.rootfs /host
85b5bfd1c14b2931f46c8ac03c40cd7c08446d7b94e61f1a5634a6beab61bb66
2、安装cadvisor
docker run --volume=/:/rootfs:ro --volume=/var/run:/var/run:rw --volume=/sys:/sys:ro --volume=/var/lib/docker/:/var/lib/docker:ro --publish=8080:8080 --detach=true --privileged=true --name=cadvisor --restart=always google/cadvisor:latest
遇到问题已启动就挂,查看日志;docker logs cadvisor
F0919 06:02:52.698457 1 cadvisor.go:172] Failed to start container manager: inotify_add_watch /sys/fs/cgroup/cpuacct,cpu: no such file or directory
W0919 06:02:53.823651 1 container.go:409] Failed to create summary reader for "/system.slice/YDService.service": none of the resources are being tracked.
F0919 06:02:53.880059 1 cadvisor.go:172] Failed to start container manager: inotify_add_watch /sys/fs/cgroup/cpuacct,cpu: no such file or directory
解决:
[root@1 ~]# mount -o remount,rw '/sys/fs/cgroup'
[root@1 ~]# ln -s /sys/fs/cgroup/cpu,cpuacct /sys/fs/cgroup/cpuacct,cpu
再次启动完成;
3、安装prometheus
https://github.com/prometheus/prometheus/releases/download/v2.21.0/prometheus-2.21.0.linux-amd64.tar.gz
二进制包,也可以使用docker安装哈
(1)将包放入到opt目录,进行解压
[root@kache opt]# tar xf prometheus-2.21.0.linux-amd64.tar.gz
#修改配置文件[root@kache prometheus-2.21.0.linux-amd64]# tail -11 prometheus.yml
- job_name: 'prometheus'
static_configs:
- targets: ['localhost:9090']- job_name: 'cadvisor1'
static_configs:
- targets: ['49.234.14.64:8080']- job_name: 'node_exporter'
static_configs:
- targets: ['49.234.14.64:9100']
集群版:
[root@kache prometheus-2.21.0.linux-amd64]# tail -11 prometheus.yml
- job_name: 'prometheus'
static_configs:
- targets: ['localhost:9090']- job_name: 'cadvisor1'
static_configs:
- targets: ['49.234.14.64:8080','10.0.0.1:8080']- job_name: 'node_exporter'
static_configs:
- targets: ['49.234.14.64:9100','10.0.0.1:9100']
启动prometheus
./prometheus --config.file="prometheus.yml" &
http://1.196.238.125:9090/targets
即可看到客户端的监控情况
4、安装garfane
https://grafana.com/grafana/download/6.3.3?edition=oss
https://dl.grafana.com/oss/release/grafana-6.3.3-1.x86_64.rpm
下载二进制安装包后,进行安装
[root@kache opt]# yum localinstall grafana-6.3.3-1.x86_64_\(1\).rpm -y
[root@kache opt]# systemctl start grafana-server.service
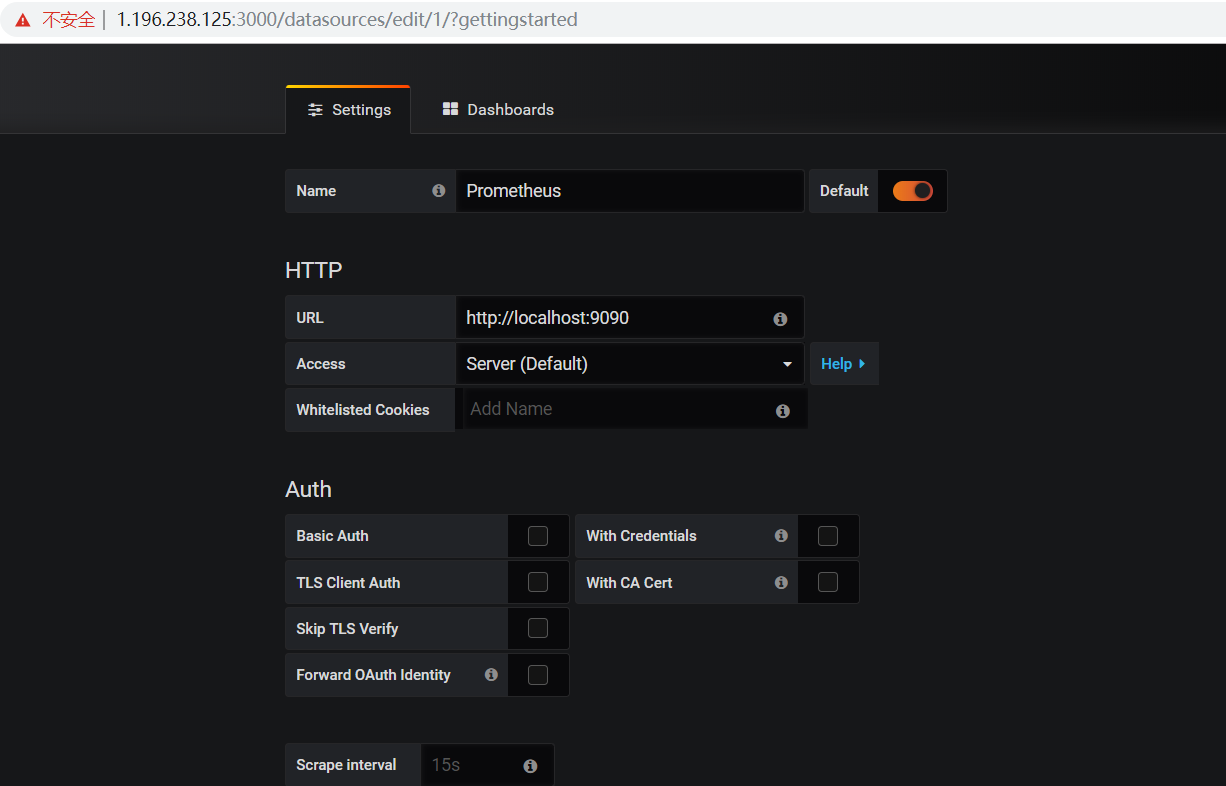
直接浏览器访问:http://1.196.238.125:3000/login
账号:admin 密码:admin 然后点击skip。
直接配置地址。保存即可
导入json文件
https://grafana.com/grafana/dashboards/8919
https://grafana.com/api/dashboards/11558/revisions/1/download
https://grafana.com/api/dashboards/893/revisions/5/download
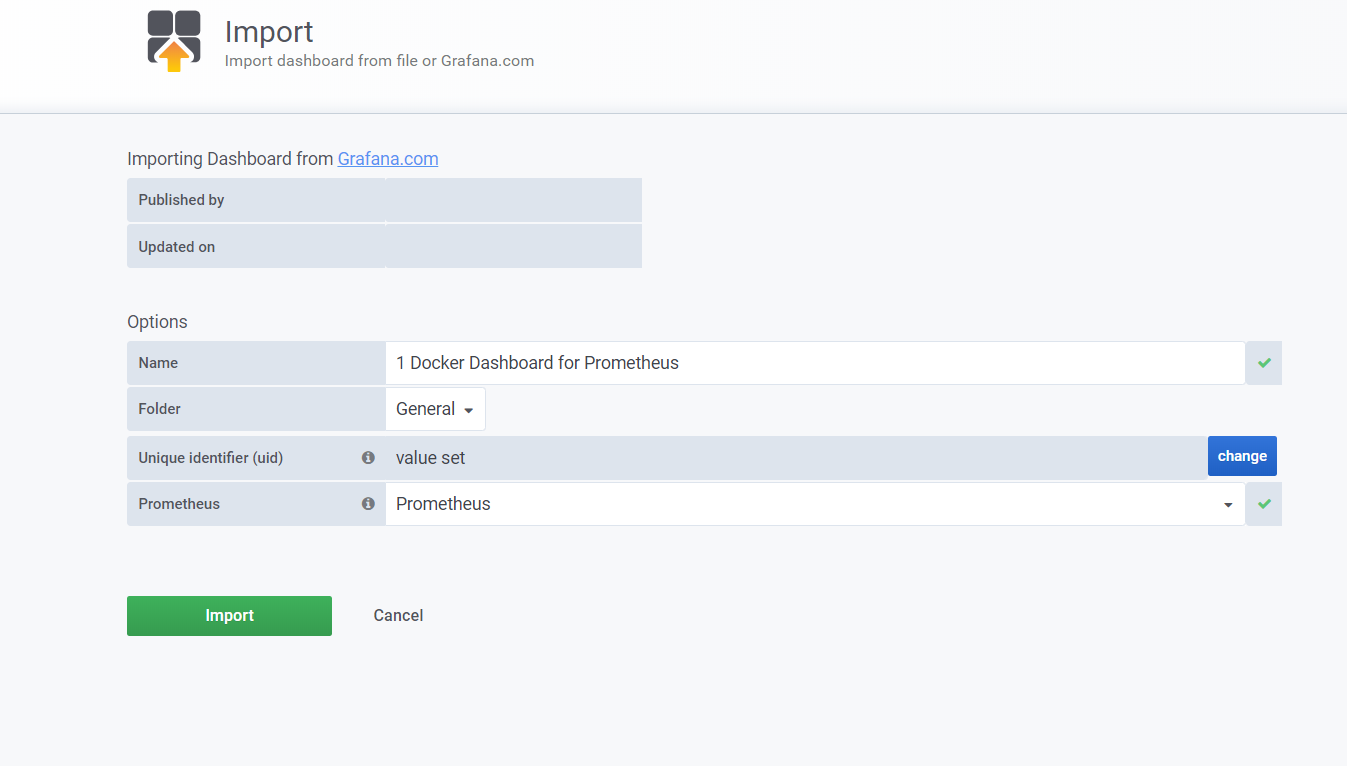
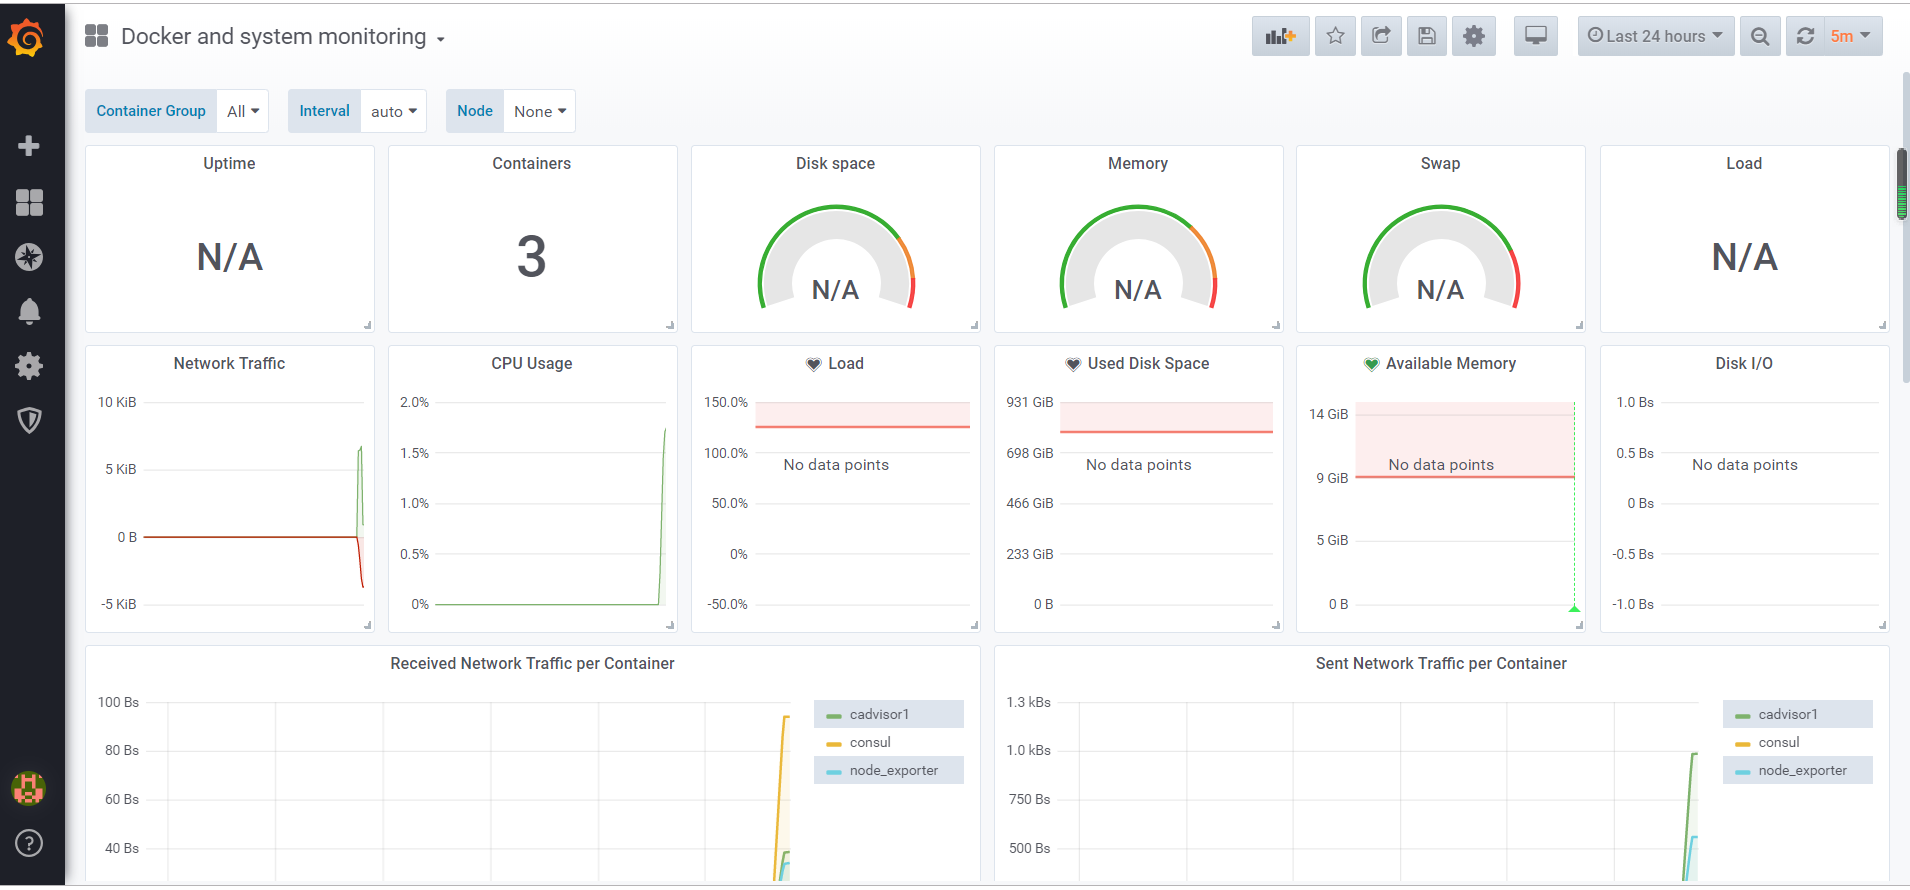
根据对应的gar版本号去下载适应的json文件即可


有问题请加博主微信进行沟通!

全部评论